Cash flow
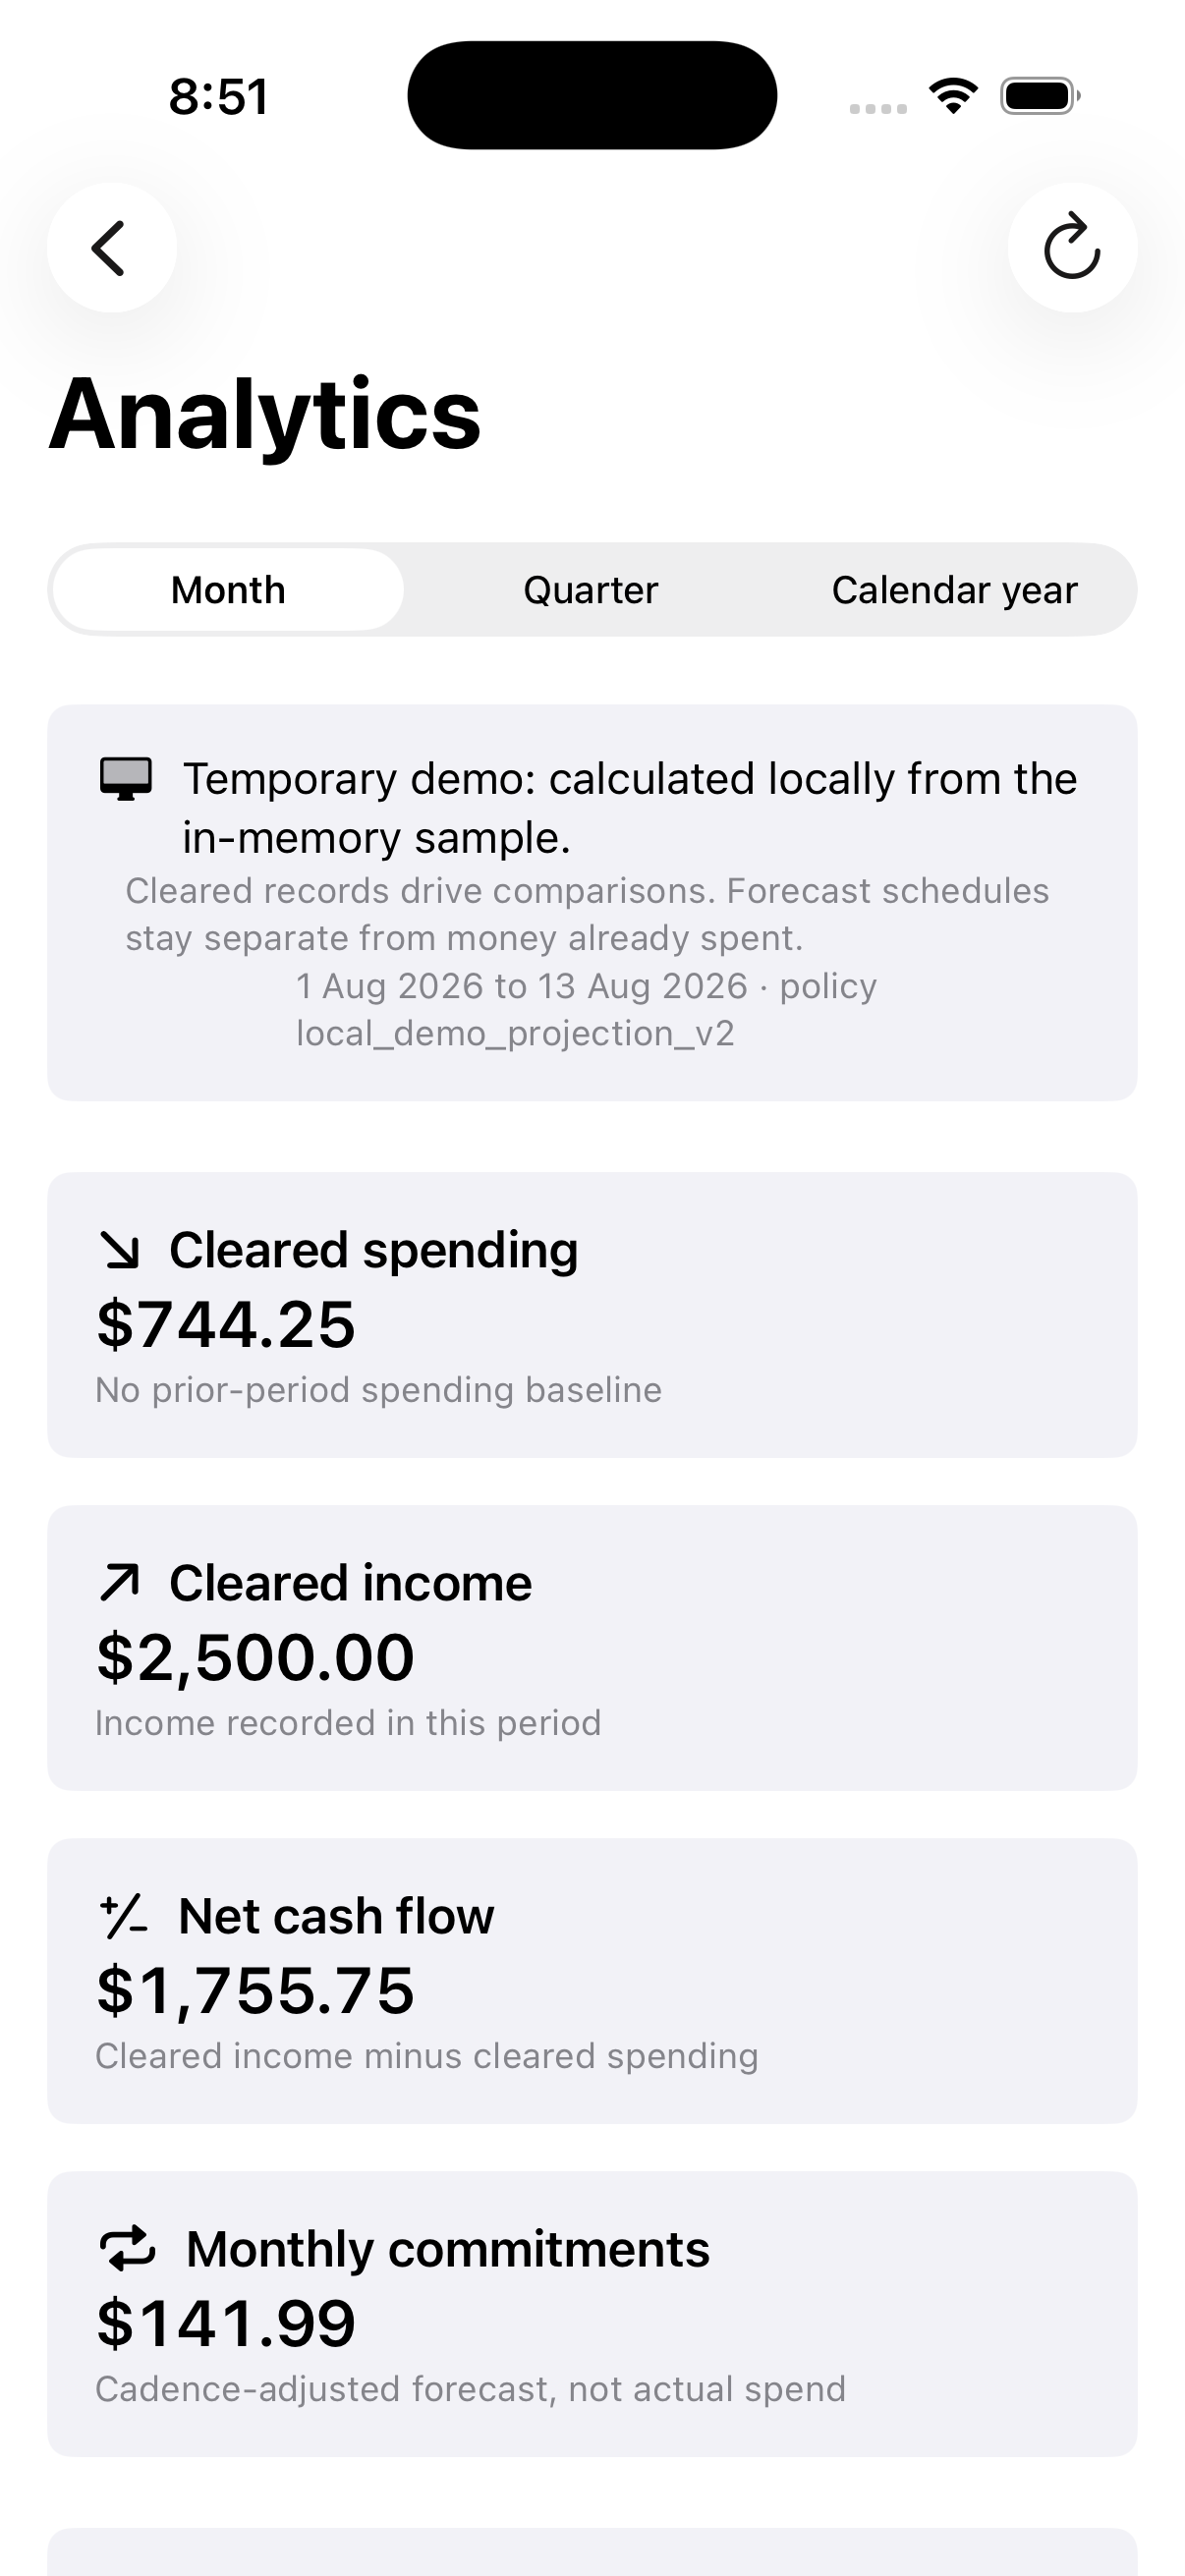
Cleared, pending and planned income and spending remain visible as distinct states.
 My Budget CanvasGet support
 Privacy-minimised insights
My Budget Canvas turns aggregate household totals into useful comparisons. This is budgeting analysis—not behavioural tracking, advertising telemetry or merchant profiling.
The aggregate boundary
The analytics response excludes merchant names, notes, account details, attachments, record identifiers, property names and raw transactions.
Cleared, pending and planned income and spending remain visible as distinct states.
Compare the selected range with the immediately preceding range of the same length.
See which cleared-expense categories moved and their share of the current period.
Understand recurring share and monthly commitment pressure without mixing forecasts into actuals.
Find the days where cleared spending tends to concentrate.
Version 1 supports reporting windows of up to 366 calendar days.
Room to grow honestly
Stable versioned analytics create room for future depth such as longer history, custom comparisons or richer exports. Version 1.0 does not gate the analytics shown here or claim that a paid plan, StoreKit product or web billing already exists.